
Armed with 4 datasets on students enrolled in the Entrepreneurship 101 MOOC on edX, I attempt to answer some interesting questions about those students who succeed (and how to encourage more of them to succeed). So first things first, let’s do some data cleaning. We have 4 separate datasets, and all provide different information, so we will use only the data that is most relevant to our question. First, we will look at which groups of students tended to complete the assignments and earn verified certificates.
## Classes 'tbl_df', 'tbl' and 'data.frame':	35647 obs. of  13 variables:
##  $ id                   : int  8 27 99 254 408 409 411 737 848 876 ...
##  $ grade                : num  0 0 0 0 0 0 0 0 0 0 ...
##  $ HW.01                : num  0 0 0 0 0 0 0 0 0 0 ...
##  $ HW.02                : num  0 0 0 0 0 0 0 0 0 0 ...
##  $ HW.03                : num  0 0 0 0 0 0 0 0 0 0 ...
##  $ HW.Avg               : num  0 0 0 0 0 0 0 0 0 0 ...
##  $ Final                : num  0 0 0 0 0 0 0 0 0 0 ...
##  $ Enrollment.Track     : Factor w/ 2 levels "honor","verified": 1 1 1 1 1 1 1 1 1 1 ...
##  $ Certificate.Delivered: Factor w/ 2 levels "N","Y": 1 1 1 1 1 1 1 1 1 1 ...
##  $ Certificate.Type     : Factor w/ 2 levels "honor","verified": NA NA NA NA NA NA NA NA NA NA ...
##  $ gender               : Factor w/ 2 levels "f","m": 2 NA NA 2 NA NA NA NA NA NA ...
##  $ level_of_education   : Factor w/ 10 levels "Associates","Bachelors",..: 8 NA NA 6 NA NA NA NA NA NA ...
##  $ Age                  : num  57 NA NA 31 NA NA NA NA NA NA ...
So we’ve landed on a good dataframe that will provide us with much of the relevant information necessary to determine what groups of students do well. Let’s recap breifly what was done. We’ve sorted the rows by student id, created ‘factor’ variables for the enrollment track (either ‘honor’ or ‘verified’) and Certificate Delivered (yes or no) and gender (male or female) and level of education (10 levels inculding HighSchool, Bachelors, etc.). We have also transformed birthdate to age of student. So now we have an appropriate set of predictors to look at a model.
We are trying to predict ‘Certificate Delivered’. This is a binary factor variable (i.e. the student either received a certificate, or they didn’t). For this we will use logistic regression. Looking initially at the whole dataset, we use gender, level of education, and age as our predictors. We do not include 3 levels of education, “P_OTH”, “PSE”, and “other” due to small sample size and a resulting high standard error. We end up with 4 significant predictors in relation to Certificate Delivered. These are, “gender = male” (p-val = 0.0008) “level of education = HS” (p-val = 0.0188) “level of education = JHS”(p-val = 8.23e-05) and “Age”(p-val = 9.38e-09). All have positive relationships to predicting Certificate Delivered, except for Age which has a negative relationship. How do we interpret these results? An intuitive explanation is that as we decrease age of student they are more likely to receive a verified certificate. Students with a level of education of JHS or HS are more likely to receive a verified certificate. And male students are more likely to receive a verified certificate. Let’s check our results.
##           Truth
## Prediction     N     Y
##          N 25552   389
##          Y  2050   104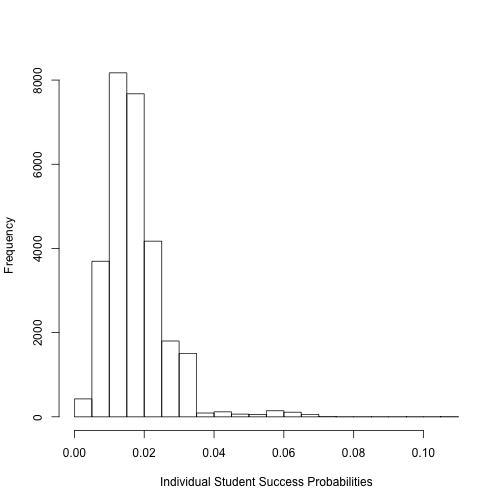
## The training error rate is 8.68126 %We can see from the histogram that most of the probabilites given by the logistic model fall around 2%. These are the probabilities of each individual student receiving a verified certificate. So controlling for false postiives/false negatives, we will assign probabilities of over 0.03 a value of “yes” and check for our predictions. We have a training error rate of about 8.7%, which is pretty good. This means that assigning student’s with probabilities of over 3% a prediction of “yes” yields in a prediction accuracy of about 91.3%. Now we will test this model on some data it has never seen before.
##           Truth
## Prediction    N    Y
##          N 3369   45
##          Y  141    9
## The test error rate is 5.218855 %So we actually end up with a better test error rate than our training error rate. This means that the model predicted the correct outcome of a student’s success about 94.8% of the time.
Now we will check how many hard workers we have. aka how many students attempted all of the assignments?
## The number of students who attempted all homeworks is 570It may also be interesting to note that 672 students attempted at least 1 assignment. So a large portion of those students that attempted an assignment, attempted all of the assignments.
Now we will check how many students actually received a verified certificate.
## The number of students who received a verified certificate is 127Other aspects of this data must be researched more thoroughly. I observed a sample of time separation data between assignment time submitted and assignment time graded, however, excluding a few outliers most grades were produced within 20mins. So this did not yield any results.
Using this information we want to know what can be done to encourage more learners to complete the course and earn a verified certificate. We see that older students do not tend to earn a certificate. This can use further research to observe what barriers to completion there are for older students (possibly scheduling issues, tech-friendliness, etc). Implementing techniques geared towards encouraging female students in the Entrepreneurship course could help with the predominantly male population. We also might want to look into why lower levels of education tend to increase odds of receiving a certificate.
One dataset I would be very intrigued to look at is the discussion board data. Observing whether or not students utilize the discussion board could be a very useful predictor for certificate delivered. Text mining techniques can also be employed to determine user interest and sentiment.